Logo
TAAT e-catalog for private sector
https://taat.africa/com/technologies/best-practices-in-pasture-management-pasture-improvement
Request information View pitch brochure

Best practices in pasture management: Pasture Improvement

Revitalize Your Pastures, Sustain Your Livestock

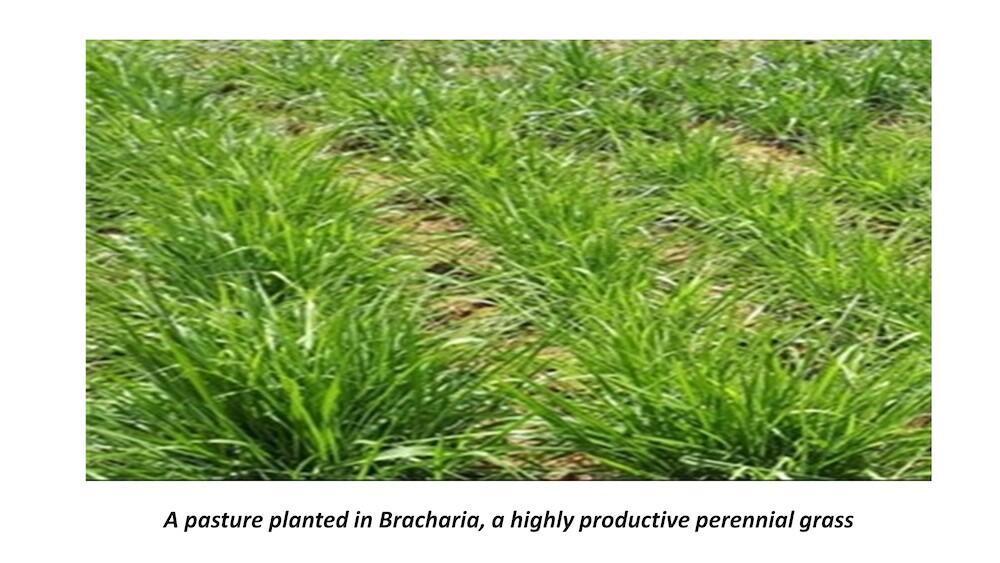
This technology aims to maintain the best species and support their productivity in managed tracts of land known as pastures. These areas receive intensive inputs like fertilizers, seeds, and irrigation, distinguishing them from less intensively managed rangelands. Various approaches are employed, including controlling weedy patches, partially disturbing the land, and sowing improved grasses and legumes. Additional methods encompass under sowing croplands with grazing plant species, establishing shrub hedgerows along pasture margins, and planting grasses with high productive capacity.
This technology is TAAT1 validated.

7•8

Scaling readiness: idea maturity 7/9; level of use 8/9

Project adoption1

Technology integrated in the ENSURE project.
See project details ›

IP

Open source / open access

Problem

  • High feed costs: Livestock producers may rely heavily on purchased feed when available pasture does not provide sufficient forage.
  • Insufficient forage supply: Poor pasture productivity can limit the quantity of feed available for livestock throughout the production cycle.
  • Reduced livestock productivity: Inadequate access to nutritious forage can constrain animal growth, weight gain, and milk production.
  • Pasture degradation: Overgrazing and poor management can progressively reduce the productivity of land used for livestock feeding.
  • Weed competition: Weed invasion reduces the availability of productive forage species and increases the effort required to maintain pastures.
  • High pasture establishment costs: Establishing productive pastures can require expenditure on land preparation, seeds, fertilizers, and other inputs

Solution

  • Lower feed costs: Producing forage on improved pastures can reduce dependence on expensive purchased feed and lower livestock production costs.
  • Increased forage availability: Improved grasses and legumes provide a more reliable source of feed for livestock.
  • Improved livestock productivity: Better quality and availability of forage can support animal weight gain and milk production.
  • Sustainable pasture use: Controlled grazing, reseeding, and regular pasture management help maintain productive forage resources over time.
  • Improved weed control: Appropriate weed management helps maintain the proportion and productivity of desirable forage species.
  • Cost-effective pasture establishment: The technology provides practical establishment approaches and guidance on budgeting for seeds, fertilizers, and other inputs. The e catalog reports establishment costs of approximately USD 400 to 600 per hectare and operating costs of about USD 40 per hectare per year.

Key points to design your business plan

The technology enhances pasture productivity, reducing users' dependency on expensive feed and decreasing operational costs. Nutrient-rich forage improves animal health and productivity, while sustainable management practices ensure soil health and biodiversity preservation. Equipping users with valuable skills creates economic opportunities and fosters long-term agricultural sustainability.

Consider the following cost breakdown:

  • Establishment Cost: New pasture establishment with improved perennial grasses ranges from USD 400 to 600 per hectare, covering land preparation (10%), weed control (13%), fertilizer (27%), and seed (50%), spread over several years.
  • Operating Costs: Approximately USD 40 per hectare per year.
  • Additional Feed Value: Pasture improvement can yield extra feed valued at USD 150 to 200 per year.
  • Seed and Fertilizer Rates: Typical input rates range from 10 to 25 kg per hectare for seeds and 50 kg per hectare for fertilizers, with smaller seed quantities needed.
  • Success Story: Brachiaria spp. pasture grass has proven successful in enhancing milk production and animal weight gain.

Partnerships with private seed companies, cooperatives, and seed growers are vital for successful implementation.

Adults 18 and over: Positive medium

The poor: Positive high

Under 18: Positive low

Women: Positive medium

Climate adaptability: Highly adaptable

Farmer climate change readiness: Significant improvement

Biodiversity: Positive impact on biodiversity

Carbon footprint: Much less carbon released

Environmental health: Greatly improves environmental health

Soil quality: Improves soil health and fertility

Water use: Much less water used

Scaling Readiness describes how complete a technology's development is and its ability to be scaled. It produces a score that measures a technology's readiness along two axes: the level of maturity of the idea itself, and the level to which the technology has been used so far.

Each axis goes from 0 to 9 where 9 is the “ready-to-scale” status. For each technology profile in the e-catalogs we have documented the scaling readiness status from evidence given by the technology providers. The e-catalogs only showcase technologies for which the scaling readiness score is at least 8 for maturity of the idea and 7 for the level of use.

The graph below represents visually the scaling readiness status for this technology, you can see the label of each level by hovering your mouse cursor on the number.

Read more about scaling readiness ›

Scaling readiness score of this technology

Maturity of the idea 7 out of 9

Semi-controlled environment: prototype

Level of use 8 out of 9

Used by some intended users, in the real world

Maturity of the idea Level of use
9
8
7
6
5
4
3
2
1
1 2 3 4 5 6 7 8 9

Project Countries Beneficiaries Budget (USD) & duration Key figures
ENSURE
Enabling Environments for Sustainable Regional Agriculture Extension
  • Kenya
  • Rwanda
  • Burundi
  • Democratic Republic of the Congo
  • South Sudan
  • Uganda
  • Tanzania
  • Direct: 3,000,000    

13.14 million

2024–2027

  • 149,940 farmers trained
  • 9,996 Training
  • 2→3.5 tons/ha cereals production expected
  • 350 agent trained 

Figures in italic are from project plans and may change during implementation.

Countries with a green colour
Tested & adopted
Countries with a bright green colour
Adopted
Countries with a yellow colour
Tested
Countries with a blue colour
Testing ongoing
Egypt Equatorial Guinea Ethiopia Algeria Angola Benin Botswana Burundi Burkina Faso Democratic Republic of the Congo Djibouti Côte d’Ivoire Eritrea Gabon Gambia Ghana Guinea Guinea-Bissau Cameroon Kenya Libya Liberia Madagascar Mali Malawi Morocco Mauritania Mozambique Namibia Niger Nigeria Republic of the Congo Rwanda Zambia Senegal Sierra Leone Zimbabwe Somalia South Sudan Sudan South Africa Eswatini Tanzania Togo Tunisia Chad Uganda Western Sahara Central African Republic Lesotho
Countries where the technology is being tested or has been tested and adopted
Country Testing ongoing Tested Adopted
Burkina Faso –No ongoing testing –Not tested Adopted
Cameroon –No ongoing testing –Not tested Adopted
Ethiopia –No ongoing testing –Not tested Adopted
Kenya –No ongoing testing –Not tested Adopted
Mali –No ongoing testing –Not tested Adopted
Niger –No ongoing testing –Not tested Adopted
Nigeria –No ongoing testing –Not tested Adopted
Senegal –No ongoing testing –Not tested Adopted
South Sudan –No ongoing testing –Not tested Adopted
Tanzania –No ongoing testing –Not tested Adopted
Uganda –No ongoing testing –Not tested Adopted

This technology can be used in the colored agro-ecological zones. Any zones shown in white are not suitable for this technology.
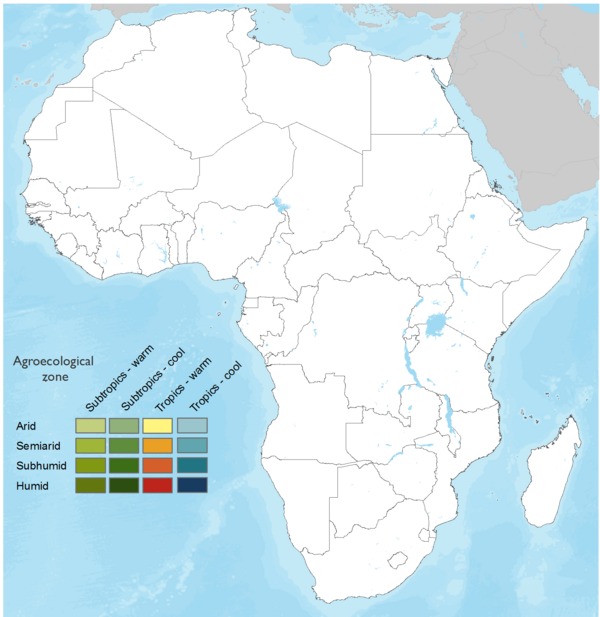
Agro-ecological zones where this technology can be used
AEZ Subtropic - warm Subtropic - cool Tropic - warm Tropic - cool
Arid
Semiarid – –
Subhumid – –
Humid

Source: HarvestChoice/IFPRI 2009

The United Nations Sustainable Development Goals that are applicable to this technology.

Sustainable Development Goal 1: no poverty
Goal 1: no poverty
Sustainable Development Goal 2: zero hunger
Goal 2: zero hunger
Sustainable Development Goal 8: decent work and economic growth
Goal 8: decent work and economic growth
Sustainable Development Goal 13: climate action
Goal 13: climate action
Sustainable Development Goal 15: life on land
Goal 15: life on land

  1. Assessment and Planning: Evaluate the specific pasture conditions, considering factors like soil type, climate, and existing vegetation.
  2. Input Application: Apply necessary inputs such as fertilizers, seeds, and irrigation, with consideration of the identified needs of the pasture.
  3. Implementation of Improvement Techniques: Carry out techniques like controlling weedy patches, partial land disturbance, and sowing improved grasses and legumes. Additional methods may include under sowing croplands, establishing shrub hedgerows, and planting high-productivity grasses.
  4. Monitoring and Management: Regularly monitor the progress of pasture improvement, assessing factors like plant growth, weed control, and overall productivity.
    Implement management practices such as re-seeding, weeding, slashing, and controlled grazing to maintain optimal conditions.
  5. Balanced Feeding and Grazing Management: Ensure that livestock have access to balanced nutrition from improved pastures, while avoiding overgrazing to prevent degradation.
  6. Adaptation and Continuous Improvement: Adjust strategies based on feedback and changing environmental conditions, optimizing pasture productivity over time.

Last updated on Oct 1, 2026